17. NetworkAnalyzer
NetworkAnalyzer computes a comprehensive set of topological parameters for undirected and directed networks, including:
- Number of nodes, edges and connected components.
- Network diameter, radius and clustering coefficient, as well as the characteristic path length.
- Charts for topological coefficients, betweenness, and closeness.
- Distributions of degrees, neighborhood connectiveness, average clustering coefficients, shortest path lengths, number of shared neighbors and stress centrality.
NetworkAnalyzer also constructs the intersection, union and difference of two networks. It supports the extraction of connected components as separate networks and the removal of self-loops.
17.1. Network Analysis
Analyze Network
To run NetworkAnalyzer, select Tools → NetworkAnalyzer → Network Analysis → Analyze Network.
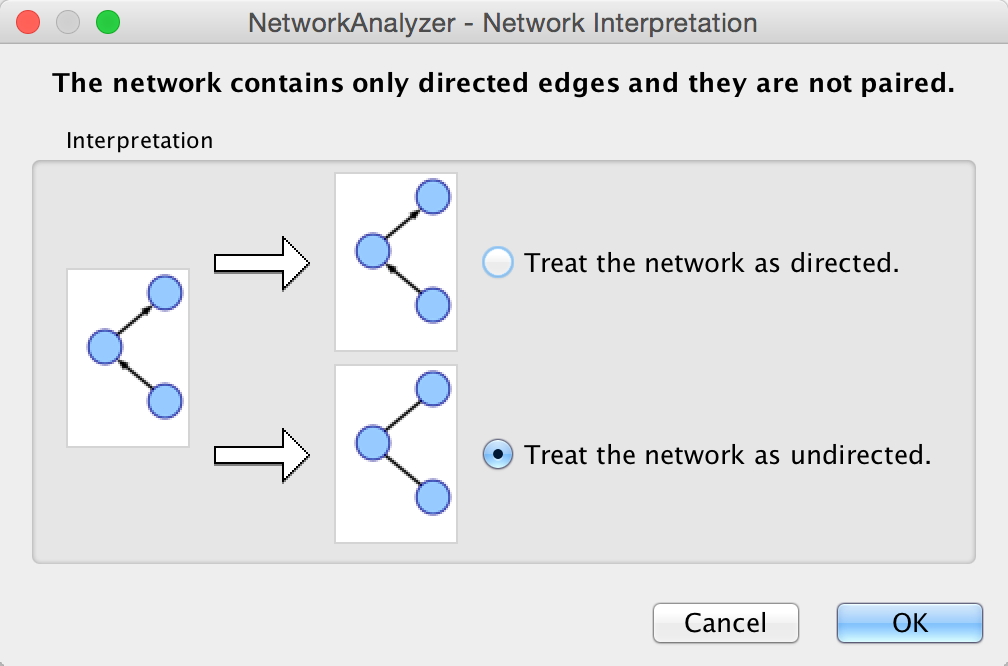
The NetworkAnalyzer will determine whether your network contains directed or undirected edges. At this point, you can choose to ignore edge direction information.
When results are calculated, they will appear in the Results Panel.
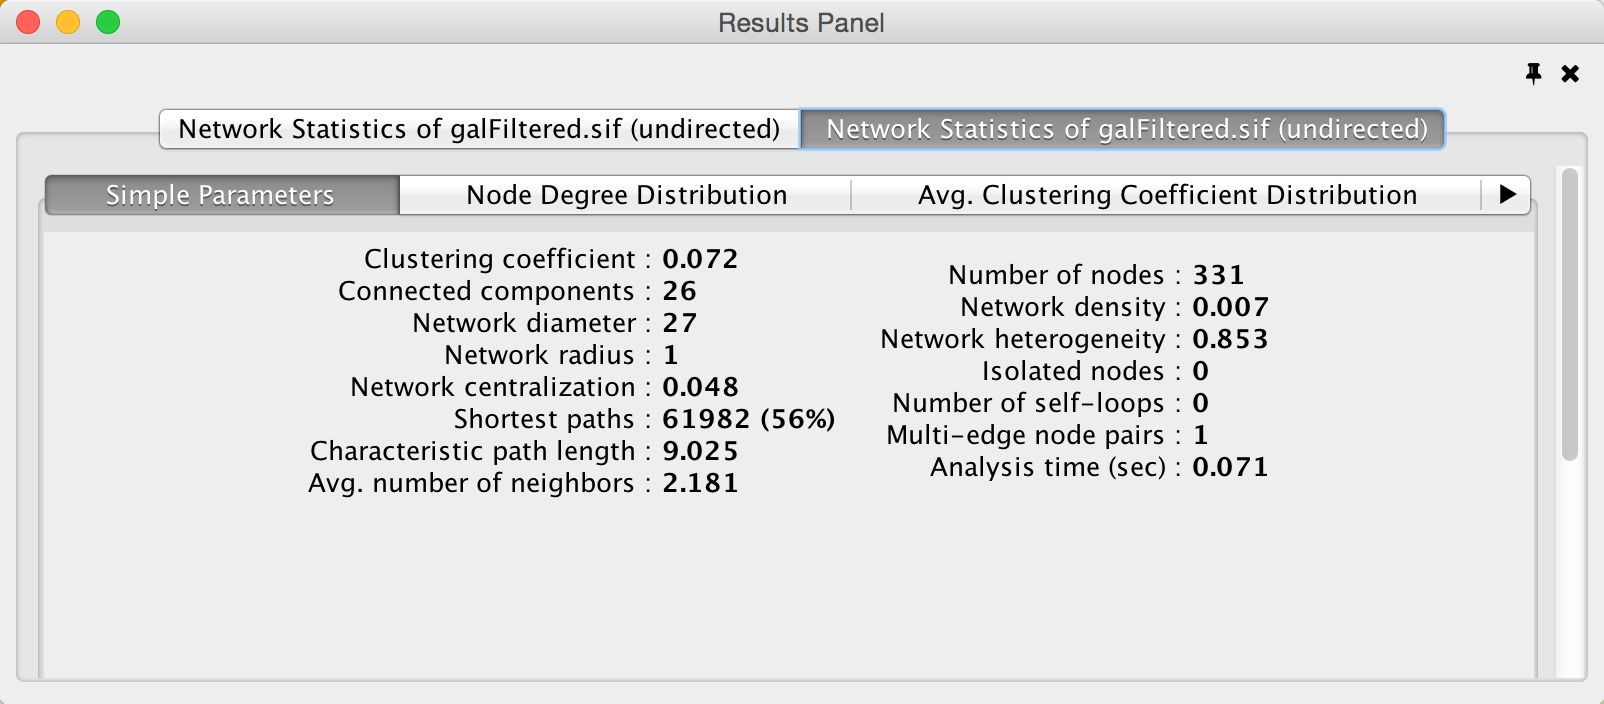
The results have multiple tabs. Details on the network parameters can be found here.
- Simple Parameters
- Node Degree Distribution
- Avg. Clustering Coefficient Distribution
- Topological Coefficients
- Shortest Path Distribution
- Shared Neighbors Distribution
- Neighborhood Connectivity Distribution
- Betweenness Centrality
- Closeness Centrality
- Stress Centrality Distribution
You can also save the statistics for later use by using the Save Statistics button.
Analyze Subset of Nodes
An exhaustive topological analysis of very large networks can be a time consuming task. The computation of local parameters for the nodes is significantly faster than the computation of global (path-related) parameters. Examples of local parameters are node degree, neighborhood connectivity, topological and clustering coefficients. Betweenness and closeness centralities, as well as stress, are global parameters.
NetworkAnalyzer provides the Analyze Subset of Nodes option for computing local parameters for a subset of nodes. If one or more nodes in the network are selected before starting an analysis, only the sub-network induced by the selected nodes is analyzed. Moreover, only local parameters are computed. Shared neighbors distribution and shortest path lengths distribution, among others, are not displayed in the results.
Batch Analysis
The Batch Analysis option is used to perform topological analysis on all networks stored in specific directory, using all possible interpretations for every network. Batch analysis consists of three simple steps:
- Selecting directories: The user selects the input and output directories. The input directory should contain network files that can be loaded into Cytoscape. Sub-directories of the input directory are not considered. The output directory is the one that will contain all analysis results after the batch analysis. In order to avoid file overwriting, NetworkAnalyzer requires that the output directory is empty (contains no files) before the batch analysis starts.
- Analysis: NetworkAnalyzer scans the input directory and loads all supported networks into Cytoscape, one at a time. Each loaded network is inspected and then it is analyzed considering all possible interpretations for it. The analysis step is complete after all networks are analyzed. Note that depending on the number of networks and their sizes, this might be a very time-consuming step.
- Inspection of results: After the analysis is complete, the button Show Results is enabled, and it displays the results dialog. The dialog contains a table of all topological analyses performed. Every row in the results table lists the loaded network, its interpretation and the resulting network statistics file that was saved in the output directory. By clicking on a network name and on statistics file name, the user can load the network and topology analysis results, respectively.
Load Network Statistics
Existing network statistics can be loaded from a file saved previously in NetworkAnalyzer.
Plot Parameters
The Plot Parameters dialog offers a possibility to plot two parameters against each other. The parameters to be plotted can be chosen from two drop-down menus. The Table Column 1 menu provides the values for the domain/category axis, and the Table Column 2 menu specifies the values for the range/value axis. The plot is updated each time a different parameter is selected in one of the menus.
Generate Style from Statistics
NetworkAnalyzer computed parameters can be visualized as node/edge size and color, if the Store node / edge parameters in node / edge table option in NetworkAnalyzer Settings is enabled. Parameters loaded from a .netstats file cannot be visualized because the network itself is not stored in the network statistics file. If, after performing topological analysis, the network is modified by introducing or removing nodes or edges, it is recommended (and sometimes required) to run NetworkAnalyzer again before visualizing any parameters.
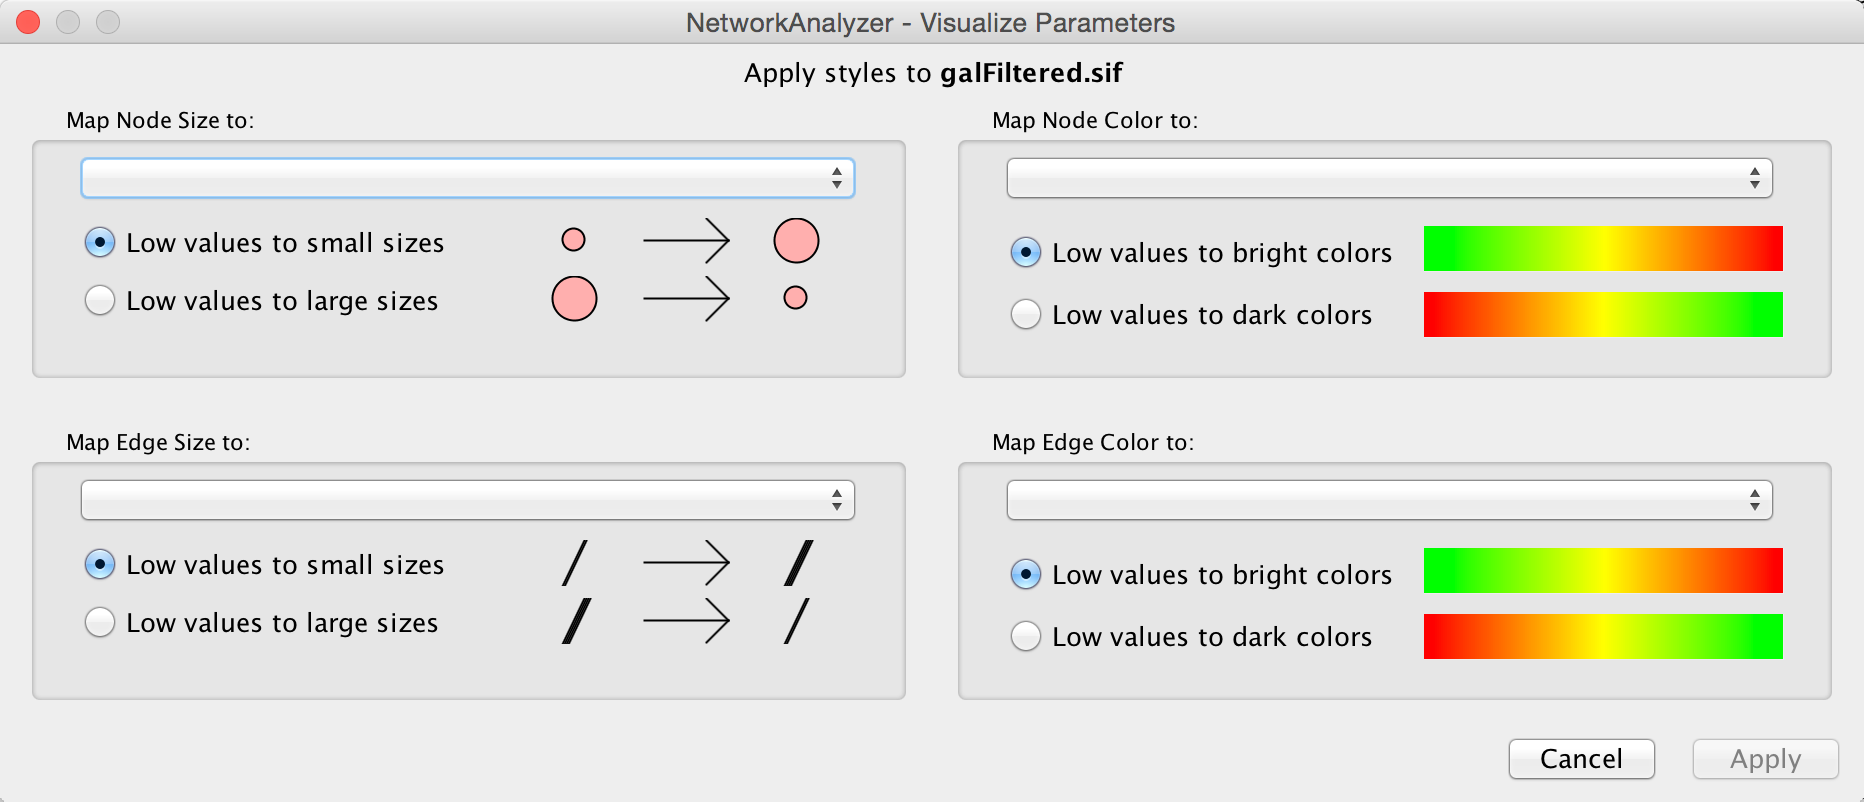
The visualization is initiated by the Generate Style from Statistics… menu option. There are two ways of mapping computed parameters.
- Map to node / edge size: The computed parameter is mapped to the size of the nodes or edges. Mapping can be straight or inverse, that is, low parameter values can be mapped to small sizes or to large sizes. The smallest node size is set to 10 and the largest one to 100. Regarding edges, size reflects the edge line width and varies between 1 and 8. Refer to the Styles section for details.
- Map to node / edge color: A computed parameter is mapped to the color of the nodes or edges. Two mapping styles are possible - mapping low parameter values to bright colors or to dark colors. By default, the brightest color is green and the darkest color is red. The mapping also uses a middle (intermediate) color, which allows for fine-grained perception of differing values through the color gradient. The default middle color is yellow.
NetworkAnalyzer Settings
The following settings can be configured by the user:
- Store node / edge parameters in node / edge table: For every node in a network, NetworkAnalyzer computes its degree (in- and out-degrees for directed networks), its clustering coefficient, the number of self-loops, and a variety of other parameters. NetworkAnalyzer also computes edge betweenness for each edge in the network. If the respective options are enabled, NetworkAnalyzer can stores the computed values as columns of the corresponding nodes and edges. This enables the users to use the values in Styles or to select nodes or edges based on the values. A complete list of the computed node and edge columns is available here.
- Use expandable dialog interface for the display of network statistics: If this option is enabled, analysis results are presented in a window in which all charts are placed below each other in expandable boxes. If this option is disabled, analysis results are presented in a window that contains tabs for the group of simple parameters and for every complex parameter (default). Users who wish to simultaneously view two or more complex parameters of one network, should enable this option.
- NetworkAnalyzer allows the user to change the default colors of
parameter visualization.
- Background color for parameter visualization: The color of the background in the network view. It is initially set to the default Cytoscape background color.
- Bright color to map parameters: This color defines the brightest color that parameters can be mapped to. By default its value is green.
- Middle color: This color defines the intermediate color, that parameters can be mapped to. By default its value is yellow.
- Dark color: This color defines the darkest color that parameters can be mapped to. By default its value is red.
- Location of the help documents: URL of the original help web page for NetworkAnalyzer. This also enables the local download and storage of this help page.
17.2. Subnetwork Creation
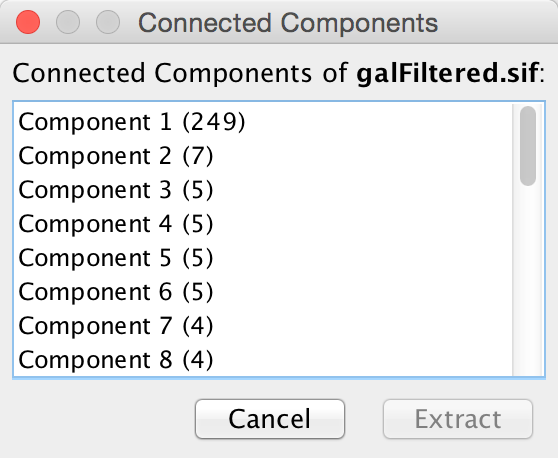
NetworkAnalyzer allows for the creation of sub-networks of connected components. The user selects a number of connected components from a list and each selected component is visualized as a sub-network. To create sub-networks from connected components, select Tools → NetworkAnalyzer → Subnetwork Creation → Extract Connected Components.
17.3. NetworkAnalyzerDemo: Computation and Visualization of Topological Parameters and Centrality Measures for Biological Networks
Yassen Assenov1, Nadezhda Doncheva1, Thomas Lengauer1, and Mario Albrecht1
1 Department of Computational Biology and Applied Algorithmics, Max Planck Institute for Informatics, Campus E1.4, 66123 Saarbrücken, Germany
NetworkAnalyzer is a versatile and highly customizable Cytoscape plugin that requires no expert knowledge in graph theory from the user. It computes and displays a comprehensive set of topological parameters and centrality measures for undirected and directed networks, which includes the number of nodes, edges, and connected components, the network diameter, radius, density, centralization, heterogeneity, clustering coefficient, and the characteristic path length. In addition, NetworkAnalyzer shows charts of the distribution of node degrees, neighborhood connectivities, average clustering coefficients, and shortest path lengths. NetworkAnalyzer also contains extra functionality, for instance, for constructing the intersection or union of two networks.
The NetworkAnalyzer plugin and a comprehensive online documentation with a tutorial are available at http://med.bioinf.mpi-inf.mpg.de/networkanalyzer/.
Data keywords: network, graph, topology
Cytoscape keywords: Network Analysis