18. Analyzer
Analyzer computes a comprehensive set of topological parameters for undirected and directed networks, including:
- Number of nodes, edges and connected components.
- Network diameter, radius and clustering coefficient, as well as the characteristic path length.
- Charts for topological coefficients, betweenness, and closeness.
- Distributions of degrees, neighborhood connectiveness, average clustering coefficients, shortest path lengths, number of shared neighbors and stress centrality.
18.1. Network Analysis
Analyze Network
To run Analyzer, select Tools → Analyze Network.
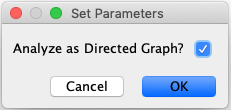
Analyzer will run different statistics depending on whether the network is directed or undirected. The app will guess which type of network it is based on the definition of a target arrow style, but since this is not
When results are calculated, they will appear in the Results Panel.
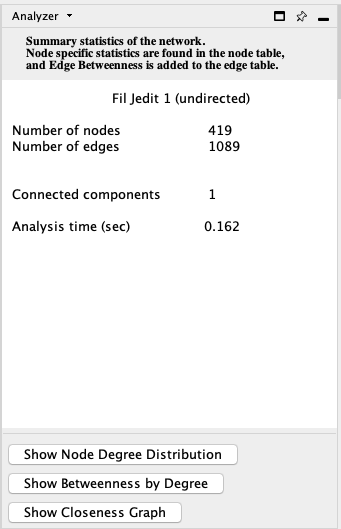
The results have multiple tabs. Details on the network parameters can be found here.
- Simple Parameters
- Node Degree Distribution
- Avg. Clustering Coefficient Distribution
- Topological Coefficients
- Shortest Path Distribution
- Shared Neighbors Distribution
- Neighborhood Connectivity Distribution
- Betweenness Centrality
- Closeness Centrality
- Stress Centrality Distribution
Analyze Subset of Nodes
Prior versions of this tool offered the option of analyzing all nodes or only a selected subset. This is no longer supported directly in the program. Instead, if you want to analyze a subnetwork, you must first use the command File → New Network → From Selected Nodes, All Edges to create the desired subnetwork.
Plot Parameters
Once the Analyzer is run, several additional columns are added to the Node Table (and an EdgeBetweenness column is added to the Edge Table). To plot any of these new columns, right-click on the column header and select Plot Histogram… for a single parameter distribution, or Plot Scatter… for a bivariate plot of the data. Within either of these charts it is possible to select a section of the data, and select the nodes (edges) in the main graph window corresponding to the region selected on the chart.
18.2. NetworkAnalyzerDemo: Computation and Visualization of Topological Parameters and Centrality Measures for Biological Networks
Yassen Assenov1, Nadezhda Doncheva1, Thomas Lengauer1, and Mario Albrecht1
1 Department of Computational Biology and Applied Algorithmics, Max Planck Institute for Informatics, Campus E1.4, 66123 Saarbrücken, Germany
Comprehensive online documentation and a tutorial for NetworkAnalyzer are available at http://med.bioinf.mpi-inf.mpg.de/networkanalyzer/.